Olivia Greco
Data mapping
Coding
Installation
Danielle Yoon
Soldering
Coding
Installation
Cheonhyun Park
Globe fabrication
Soldering
Installation

Global Reality is a 3D visualization of the effects of global warming over the past 135 years, from 1880 to 2015.
The light sequence is based on data from Nasa’s Scientific Visualization Studio that illustrates Earth’s long-term warming trend from 1880 to 2015 as a rolling five-year average.
2015 was the warmest year since modern record-keeping began in 1880.


We divided the video into 90 still frames and drilled 128 holes evenly-spaced across the globe. and mapped each hole to a coordinates on the flat 2D map from the video. In each of the 90 frames, we recorded the RGB value for each coordinate. This RGB value would correspond to the LED showing through that hole on the 3D globe. We Chose to only map continents because our intent was to show the globe in a dark setting, and when the LED’s light up, we wanted it to be obvious the viewer was looking at a globe.
We soldered 128 neopixel LEDs together and fixed the LEDs to the inside of each hole with hot glue and electrical tape. We programmed the LED sequence using an Arduino Mega. View our code here.
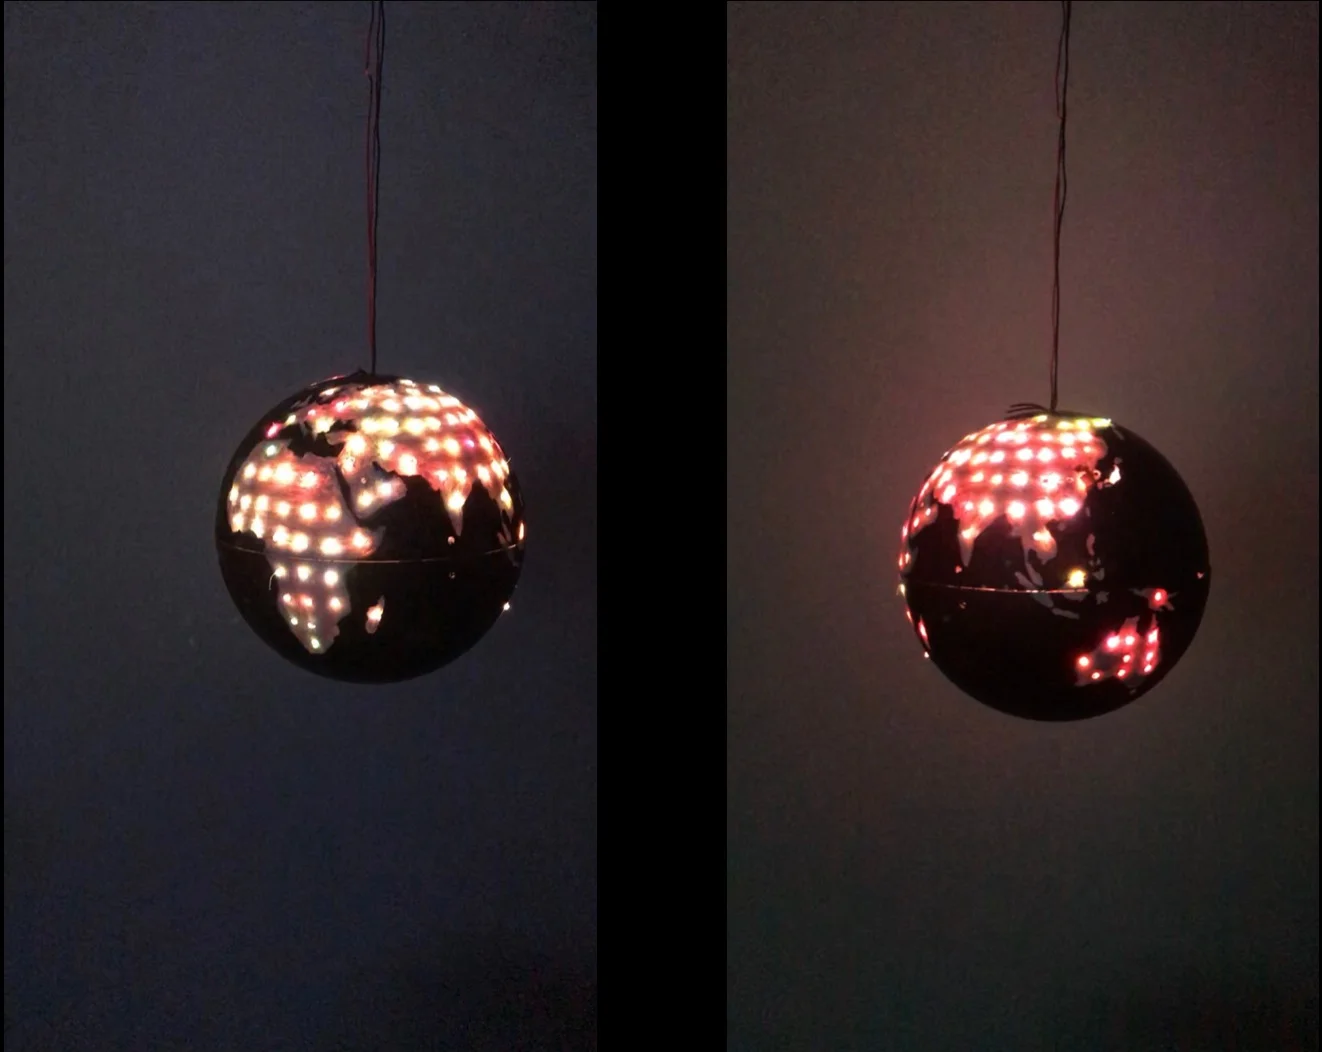
We see the Global Reality installation in a museum or exhibition setting where visitors could enter an exhibit and learn about global warming’s effects on the earth.